

The question is whether you’re forecasting or firefighting. After the tariff‑driven surge in May–June, spot rates have eased and settled through early August. Capacity is plentiful, blank sailings are doing the heavy lifting, and this year’s “peak” looks more like a ripple than a wave.
The wins now come from lining up space where was formerly tight, getting a better price but watching congestion hot spots, and letting PO‑level insight guide the plan.
Executive Summary
• Global indices eased again and have largely stabilized since mid‑July; expect a shallow peak with tactical GRI attempts by carriers.
• Effective capacity remains ample (newbuilds + Cape absorption); carriers are using blanks/extra‑loaders to defend utilization.
• Transpacific: Big declines since June; August slide moderates—bias still flat → down into September.
• Asia Europe/Med: Softer to stable; Med premium over North Europe compressed; selective blanks shape weekly prints.
• North Atlantic: Stable overall; inland EU frictions and port pulses reduce effective frequency some weeks.
• Oceania: East Asia→AU firming near‑term on RRIs/blanks; SE Asia→AU flatter.
• Ops watch: Northern Europe congestion elevated in pulses; Singapore sticky but improving; China hubs see weather‑driven bunching.
Market Benchmarks — Drewry WCI (Public Charts)
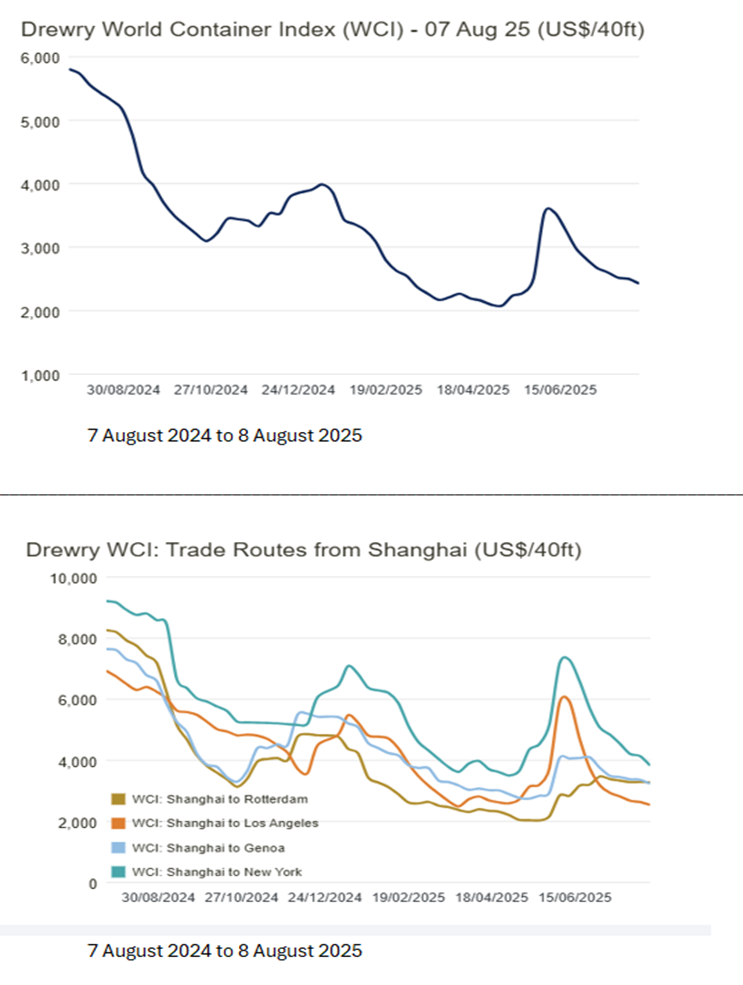
Drewry World Container Index and Shanghai route benchmarks — 7 Aug 2024 to 8 Aug 2025 (public image).
Lane Scorecards (Capacity • Demand • Equipment • Rate Outlook)
Transpacific — China/East Asia → USEC
• Supply/Capacity: Loose; carriers adding blanks to slow declines.
• Demand: Flat/soft; SE Asia steadier than China mains.
• Equipment: Improving at origin; inland chassis pinch episodically.
• Rates/Outlook (4–6 wks.): Flat with a down bias; GRIs tactical/short‑lived.
Transpacific — China/East Asia → USWC
• Supply/Capacity: Ample; more blanks appearing week‑to‑week.
• Demand: Flat.
• Equipment: Normalizing.
• Rates/Outlook (4–6 wks.): Range‑bound to softer near‑term.
Transpacific — Southeast Asia → USEC
• Supply/Capacity: Loose; extra loaders diluted July firmness.
• Demand: Mixed; not enough to lift prices.
• Equipment: Generally available.
• Rates/Outlook (4–6 wks.): Drifting down; GRIs face resistance.
Transpacific — Southeast Asia → USWC
• Supply/Capacity: Loose, piggybacking on TP capacity.
• Demand: Moderate.
• Equipment: Normal.
• Rates/Outlook (4–6 wks.): Flat with a down probable; GRIs unlikely to stick in Aug/Sep.
Asia /Europe – China/East Asia → North Europe
• Supply/Capacity: Adequate; selective blanks steady load factors.
• Demand: Stable/slower vs July.
• Equipment: Generally fine at CN hubs.
• Rates/Outlook (4–6 wks.): Flat → Slightly down; GRIs tied to blanking pulses.
Asia /Europe – China/East Asia → Mediterranean/N. Africa
• Supply/Capacity: Adequate; earlier extra loaders now absorbed.
• Demand: Cooling from June highs.
• Equipment: Normal.
• Rates/Outlook (4–6 wks.): Easing/flat; watch Eastern Med transshipment.
Asia /Europe – India/Sri Lanka → North Europe
• Supply/Capacity: Balanced → tight on select weeks.
• Demand: Improving marginally.
• Equipment: Feeder dependence can pinch boxes.
• Rates/Outlook (4–6 wks.): Up/firming; small GRIs possible.
Asia /Europe – India/Sri Lanka → Med/N. Africa
• Supply/Capacity: Balanced.
• Demand: Firm pockets.
• Equipment: Manageable with pre‑alerts.
• Rates/Outlook (4–6 wks.): Up; minor GRIs possible.
TransAtlantic — North America → Europe
• Supply/Capacity: Stable; frequency affected by North Europe congestion pulses.
• Demand: Balanced/sluggish.
• Equipment: EU inland imbalances (barge/rail) linger.
• Rates/Outlook (4–6 wks.): Soft‑to‑flat; limited GRIs.
TransAtlantic — Europe → North America
• Supply/Capacity: Adequate but terminal/rail frictions reduce effective frequency intermittently.
• Demand: Moderate.
• Equipment: 40’HC deficits persist in areas.
• Rates/Outlook (4–6 wks.): Flat at elevated YoY; small GRIs where congestion bites.
Oceania — China/East Asia → Australia
• Supply/Capacity: Temporarily tight (blanks/RRIs).
• Demand: Seasonal restock pockets.
• Equipment: Generally fine; check rural AU delivery points.
• Rates/Outlook (4–6 wks.): Up/firm near‑term; GRI risk moderate.
Oceania — Southeast Asia → Australia
• Supply/Capacity: Balanced; carriers testing RRIs.
• Demand: Improving pockets.
• Equipment: Normal.
• Rates/Outlook (4–6 wks.): Flat → Slight up with RRIs.
Oceania — India/Colombo → Australia
• Supply/Capacity: Balanced.
• Demand: Stable.
• Equipment: Feeder timing matters.
• Rates/Outlook (4–6 wks.): Flat → Slight up.
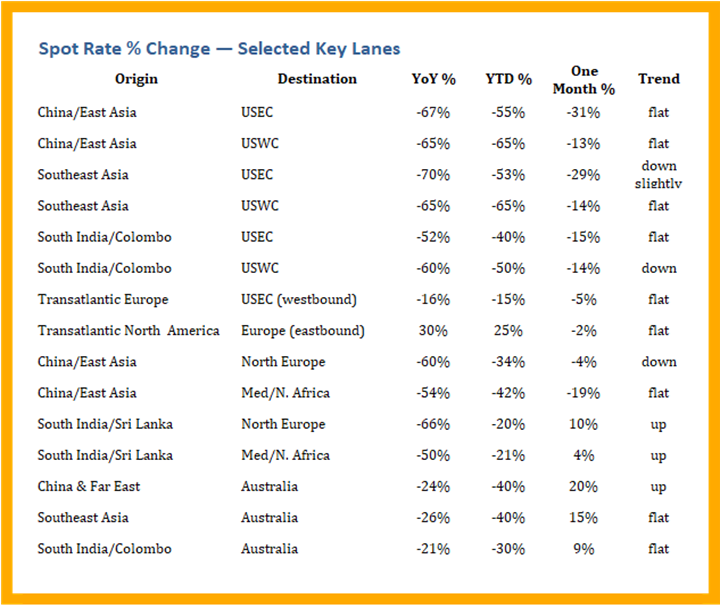
SPOT / Short Term Rate Change by %
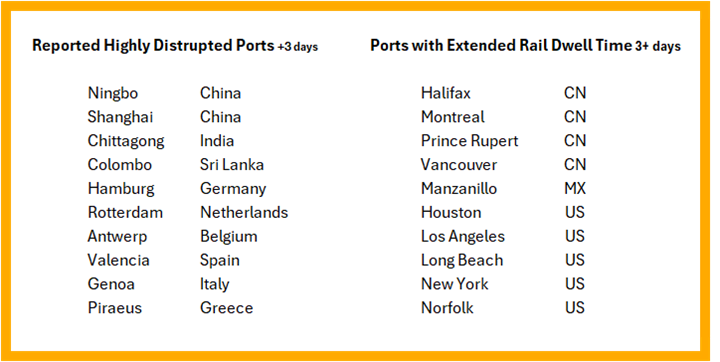
Port Congestion Watch — Top Hubs (>3‑day risk)
• North Europe (Rotterdam, Antwerp‑Bruges, Hamburg, Bremerhaven): Elevated in pulses; 3–5‑day vessel delays observed at times; inland rail/barge constraints amplify backlogs.
• Singapore: sticky but improving; typical waits under 2 days with spikes on bunching.
• China hubs (Shanghai/Ningbo/Shenzhen): Weather/arrival bunching cause intermittent 2–3‑day slips; generally manageable.
• US gateways (LA/LB, NY/NJ): episodic inland equipment/chassis pinch; no systemic gridlock.
Red Sea / Suez
Security remains fragile. Some escorted Suez transits have resumed, but many services continue via the Cape, keeping transits longer and schedules variable. Net effect: modest capacity absorption and ongoing schedule risk.
Fleet Growth, Scrapping & MSC Scale — 2025–2027
Fleet growth & scrapping (2025–27): An orderbook equal to ~25–30% of today’s fleet lands mostly in 2025–27 while scrapping stays low. Even with some Cape diversions soaking up tonnage, net capacity rises. Base case: Overcapacity unless carriers idle ships, slow-steam harder, or pull loops.
Will demand catch up? Consensus points to low single-digit growth, uneven by region and clouded by tariffs. It may steady pockets but won’t absorb the delivery wave. Expect tactical GRIs, more blank sailings, and choppy week-to-week rates, not a durable upcycle.
Carrier scale & strategy: MSC remains well ahead on deployed TEUs with a deep orderbook; peers likely won’t match on size, so competition shifts to network quality, reliability, inland reach, and end-to-end services.
Number two Maersk, for its part, is holding the line on new tonnage and leaning into schedule reliability; early results from the Gemini partnership with Hapag-Lloyd show meaningful on-time gains and fewer rolls. If that holds, shippers may trade a small rate premium for predictable lead times on time-sensitive flows.
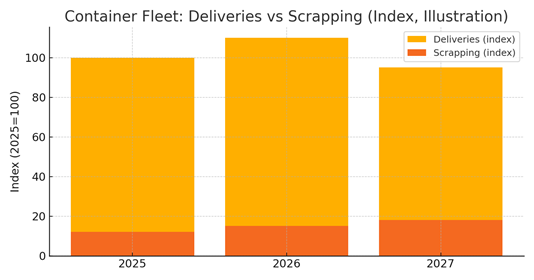
Illustrative index only (no TEU levels): deliveries remain above scrapping through 2027.
6‑Month View (Global Supply vs Demand)
Capacity: Delivery pipeline strong; scrapping muted → structural overcapacity persists into 2026 even with Cape diversions.
Demand: Carriers guide ~2–4% 2025 volume growth, stronger outside North America.
Rates: Range‑bound averages with tactical GRIs and lane‑specific volatility; sustained lifts require meaningful capacity withdrawal.
Actions — WOWL Playbook
• Lock capacity on vulnerable weeks (pre–Golden Week); keep alt gateways warm.
• Publish PO+cube forecasts 8–12 weeks out; right‑size equipment and consolidate intentionally.
• Scorecard partners weekly (on‑time, utilization, damage, rolls).
• Pre‑check live congestion at North Europe/Singapore and other key ports to buffer for the around the “Cape” routing.
Sources & Methodology
Sources: WOWL analysis; Xeneta (subscription, % changes only); Drewry WCI public charts (user‑provided image); public port & carrier advisories. No dollar levels reported. Spot figures shown are % changes only (YoY, YTD, Last 30 days).
