

Your dashboard tells you the problem: containers aren’t filling up. Utilization is slipping, landed cost is rising, and someone asks the question your top-line metric can’t answer: Where is it happening, who is doing it, and why? I’ve had that problem—and if you ship steady volume to big DCs, you’ve probably had it too.
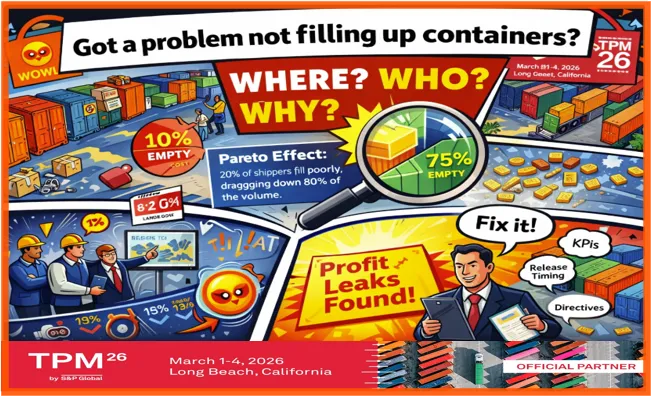
At first we saw an “okay” average. But we knew the rule of most logistics' problems: Pareto. Most of our shippers were doing fine. But a small group were doing badly and killing our numbers.
In our case, 85% of the volume came from about 15% of the shippers, and half of those big shippers were our own factories. When we drilled down by shipper and destination, the story got ugly fast. A handful of regular shippers were averaging 75% full on containers even to our largest DCs, with multiple containers every week. In our business, “practically full” meant about 88% (+/- 2%). Overall because of the poor performers, our gap was roughly 10% air that should have been filled.
That 10% wasn’t “nice to have.” On the biggest DC lanes, it worked out to about a 10% hit to total landed cost on those volumes. We paid for almost the same container moves, dray, terminal handling, and overhead—then spread that cost across fewer units, millions $$ lost.
The worst part? Some of the excuses came from inside. Our factories said they were meeting month-end KPIs and invoicing cutoffs. They shipped partial loads to make their local numbers look good. The company paid the bill.
Once we could see the pattern, the fix was clear. The hard part was finding it early, proving it, and forcing action. That’s where deeper BI and AI change the game. You need analytics that drill from “overall utilization” down to the exact shipper, lane, and week that’s leaking money—then AI that watches continuously and flags repeat offenders before waste becomes “normal.”
That’s what WOWL does.
We build the platform and the BI structure, add AI that highlights the profit leaks, and deliver clear flags to your logistics team: what’s wrong, where it is, how often it’s happening, and what it’s costing. If you have the bandwidth, your experts act on the insights. If you don’t, WOWL can provide full or even fractional support—working side-by-side with your staff, with optional extended coverage in key global locations.
You know the goal; the goal is simple: stop managing averages and start recovering the hidden 10%.
See you all at TPM26, Andy
AndyG@WOWL.io
#GlobalLogistics #SupplyChain #OceanFreight #OrginManagement #FreightOptimization #LogisticsAnalytics
#BusinessIntelligence #AIinSupplyChain #ITMS
