

Opening snapshot
As we move into February, the ocean market feels a bit like sailing in shifting winds: the New Year GRIs have already crested, the pre-Chinese New Year rush is fading, and our index shows spot levels now typically 15–30% below the last 1–3 months and 25–55% below a year ago on key head haul trades. Demand is mild, capacity is abundant, and routing, tariffs, and geopolitics keep rewriting the playbook in real time—but beneath the noise, the same themes hold: an over-supplied market, softer but jumpy rates, and an industry that’s still very much in the game.
Key market points
A. Demand
- Global: low single-digit growth
- U.S. imports: first m/m uptick, still below 2025
- Europe: okay volumes; higher costs + congestion
- Near term: post-CNY demand dip
B. Capacity
- Fleet +~4% in 2026; large orderbook → oversupply
- Pre-CNY: extra capacity on Asia–EU, Asia–Med, TPEB
- Post-CNY: blank sailings as main rate lever
C. Suez / Red Sea
- Mix of Suez and Cape routings
- More Suez → shorter voyages, more effective capacity, more rate pressure
- Security / geopolitics = routing wild card
D. Reliability & ports
- N. Europe: winter + yard + rail/river issues → 1–3 day delays
- Asia hubs: Singapore, Shanghai, Ningbo → bunching, transshipment stress
- North America: main ports fluid; Vancouver rail + winter sensitive
E. Pricing & contracts
- 2025 vs 2024: ~40–45% lower on main trades
- Feb levels: many lanes 15–30% below Jan peaks
- ETS: higher structural cost floor for EU trades
- Contracting: hybrid = annual framework + index + quarterly/mini-bids
F. Air vs ocean
- 2025 air: +3–4%, Dec up mid-single-digits
- Pre-CNY bump ex-Asia; no extreme spikes
- Post-CNY: soft patch, then Q2 normalization
WOWL Spot Rate Trend Index (7 Feb 2026)
Logic:
Negative % = today cheaper than past; positive % = today more expensive than past.
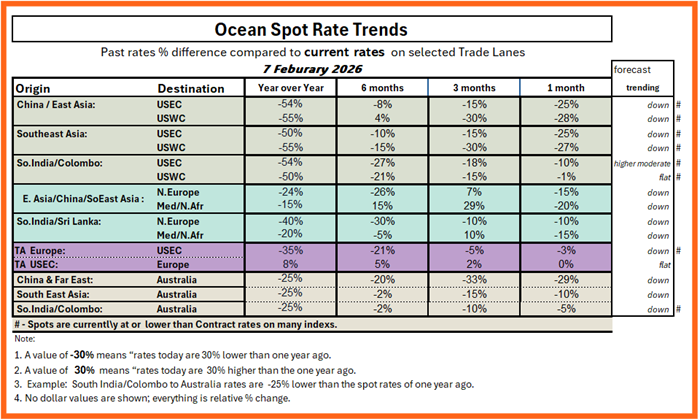
Year-on-year snapshot
- Asia→US: today ≈ 50–55% lower than Feb-2025
- Asia→N. Europe/Med: ≈ 15–25% lower
- ISC→US/EU: ≈ 40–55% lower
- Asia/ISC→AU: ≈ 25–30% lower
- TA EU→US: ≈ 35% lower; TA US→EU: ≈ 8% higher
Headline:
Most head haul trades 25–55% cheaper than a year ago; USEC→Europe slightly above last year.
Short-term view (1–3 months) + trend
- Asia→US (TPEB): 1–3M strongly negative → DOWN
- Asia→N. Europe: slightly above 3M, ~15% below 1M → DOWN, choppy
- Asia→Med/N. Africa: still premium vs 3M, ~20% below 1M → DOWN
- ISC→USEC: 10–18% below 1–3M → HIGHER (moderate)
- ISC→USWC: slightly below 3M, flat vs 1M → FLAT
- ISC→Europe/Med: ~10–15% below 1–3M → DOWN (gentle)
- Asia/ISC→AU: clear negative vs 1–3M → DOWN
- TA EU→US: small negatives → DOWN (slow)
- TA US→EU: near flat → FLAT
Top issues (focused)
- Overcapacity downcycle: too many ships; rates biased lower, spikes short-lived
- Spot vs contract: many lanes now near or below typical contract levels
- EU ETS + cost stack: ETS + fuel keep EU all-in rates sticky even as base ocean drops
- Port & inland friction: N. Europe terminals + rail/river, Asia hubs, Vancouver rail – small shocks, visible delays
Trade-lane future snapshots (6–10 weeks)
- Asia→USWC: soft–moderate demand; well below 1–3M and YoY; trend DOWN
- Asia→USEC/USGC: softer than WC, longer haul; similar down pattern, higher structural floor; trend DOWN (higher floor)
- Asia→N. Europe: winter + inland issues; above 3M, below 1M; trend DOWN, choppy
- Asia→Med/N. Africa: still premium vs 3M, off 1M highs; trend DOWN
- ISC→USEC / USWC: below 1–3M; trend HIGHER (moderate) to USEC, FLAT to USWC
- ISC→Europe/Med: trend DOWN (gentle)
- Transatlantic EU↔USEC: trend EU→US DOWN (slow); US→EU FLAT
- Asia/ISC→Australia: trend DOWN
Port & gateway watchlist
- Asia: Singapore, Shanghai, Ningbo – bunching / transshipment risk
- ISC/ME: Colombo, Jebel Ali – episodic congestion
- N. Europe: Hamburg / Rotterdam / Antwerp – key friction cluster
- N. America: LA/LGB, NY/NJ, Savannah, Norfolk fluid; Vancouver sensitive
Global Air freight – quick view
- Stronger base than last year
- Pre-CNY bump; no extreme spikes
- Next: post-CNY dip, Q2 normalization; air = backup, not baseline
Outlook – 4 and 6 months out
- 4 months: contract season in downcycle; shippers hold leverage
- 6 months: low-rate, high-volatility baseline; use hybrid contracts, index links, mini-bids, ETS clauses
Closing Snap!
The picture stays messy but pricing seems good and capacity strong for shippers. But no matter what happens next, our industry is strong. Trouble is when we are at our best.
Global transportation is built on resilience and creativity: shipping lines constantly re-cutting networks, air carriers flexing lift at short notice, forwarders stitching together workarounds in real time, and customers willing to adapt plans to keep product flowing. Every day, teams make a thousand micro-decisions that never make the headlines but keep supply chains alive.
So, we plan for softer rates, good capacity, and choppy demand. We watch tariffs and hotspots. We keep contracts flexible and options open. And then we do what this industry always does: we improvise, we execute, and we deliver.
Happy Lunar New Year to all.
AndyG@WOWL.io
WOWL.io
