

Three articles for global logistics leaders on freight cost leakage and savings controls.
Part One: Where Freight Cost Leakage Really Starts
The most expensive freight problem is usually the one nobody sees soon enough.
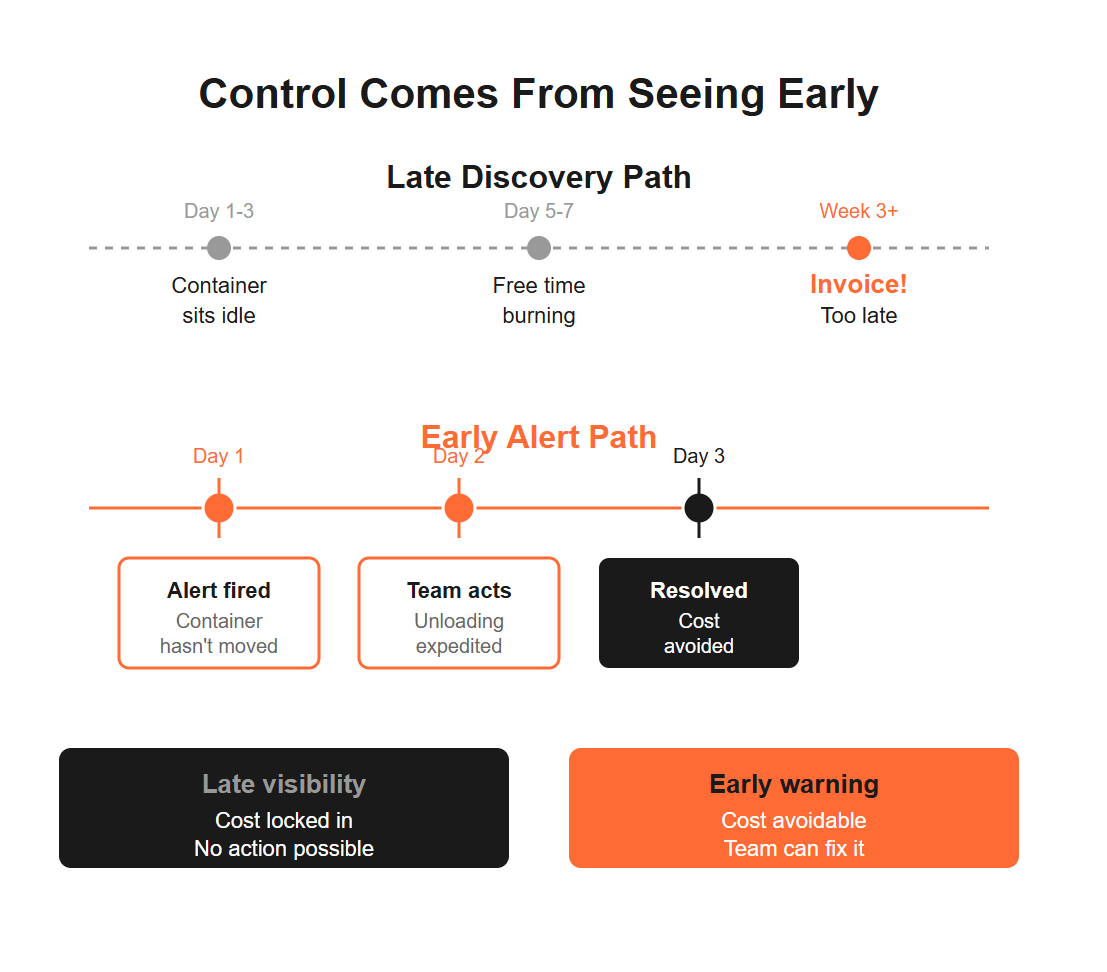
That is how cost leakage starts. It does not begin when the invoice lands in the Finance department. It starts when a container sits too long, a shipment moves on the wrong service, or a team misses a handoff while the clock is already running.
Detention and Demurrage and other per diem charges are a common example. A container can sit at the port, at the DC, or at the customer site for days before the real owner of the cost knows there is a problem. By the time the invoice shows up, the margin is already gone. That is not just a fee problem. It is a visibility problem.
The same thing happens with contracts. A company may win strong ocean rates but lose the value by routing the volume away from the correct carrier, lane, or service. MQCs get missed. Spot freight use grows where it should not. A contract that looked smart on paper gets weaker in real life.
Mixing contract and spot is a business choice. It should not be a random shipping desk habit.
Mode choice leaks money too. LCL can look cheaper than FCL on the rate sheet. But lower ocean cost is not always lower landed logistics. A shipment under 10 CBM, and even under 15 CBM, may still belong in a 20-foot container as FCL if it is fragile, high value, urgent, or exposed to damage and delay in the LCL chain. If you are in a hurry, LCL many times adds a few more weeks to transits!
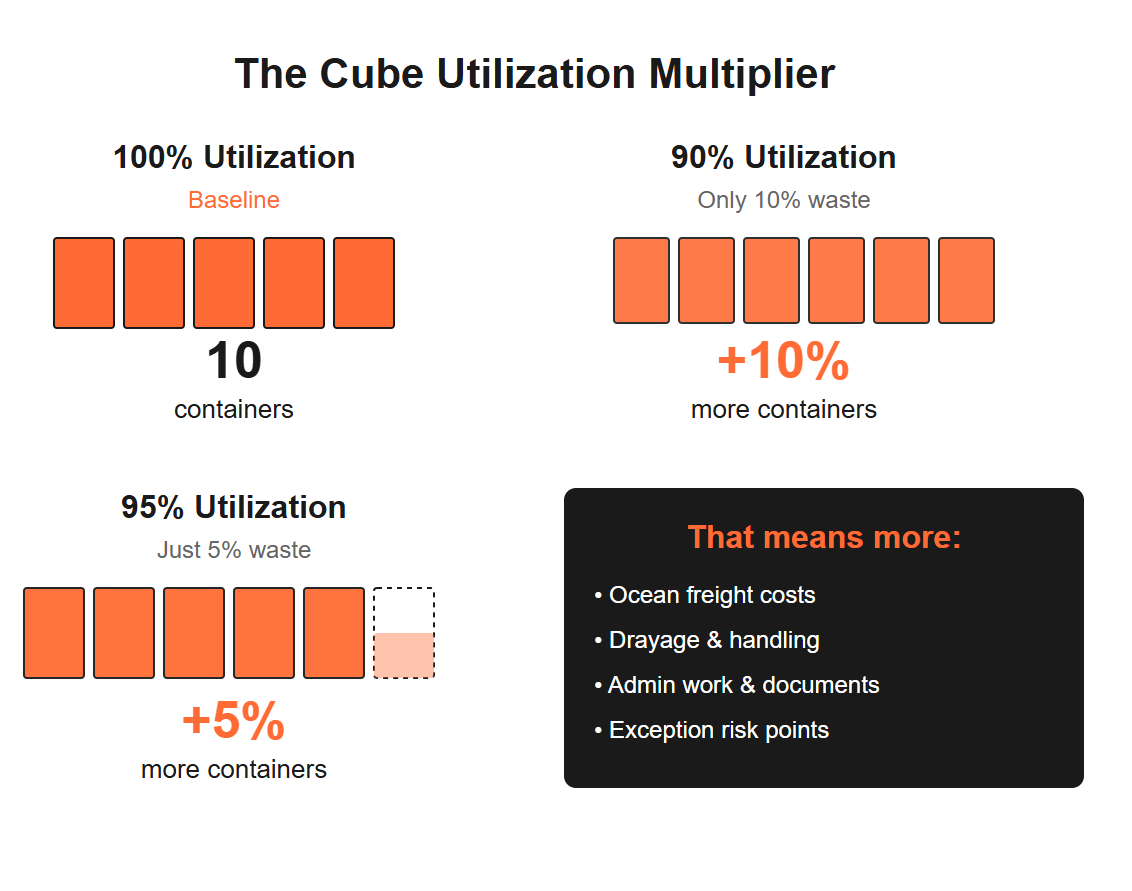
Cube Utilization is another quiet leak. A network running at only 95% usable cube needs roughly 5% more containers over time than using the full space. At 90%, it may need roughly 10% more. That means more ocean freight, drayage, handling, admin work, and exception risk. You pay for the space you dont use!
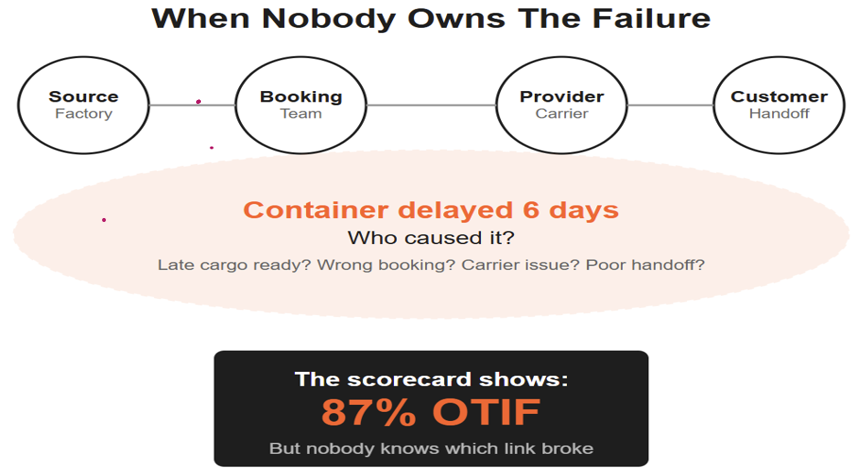
The biggest leak is blurred ownership of a failure. Who caused the failure in the first place? The shipper at origin? The carrier or forwarder? A document clerk? And then many times the failure is just passed on to each next partner in the chain leading to final destination. How often do same types of failures reoccur without any investigation or corrective actions?
Freight cost leakage rarely comes from one big mistake. It comes from small problems that stay hidden too long and get owned too late. That is where savings work has to start.
Cost Leaks to Watch First
|
Leakage point |
What it looks like |
Control move |
|
D&D exposure |
Container sits while free
time burns and per diem charges add up. |
Alert on dwell, unload, and
empty return before the invoice exists. |
|
Contract and MQC drift |
Volume misses the planned
carrier, lane, or service mix. |
Manage contract and spot
use by lane, season, and business priority. |
|
FCL/LCL misread |
The lower rate creates more
handling, delay, or damage. |
Choose the better landed
logistics ex-duty result, not just the lower ocean rate. |
|
Weak cube use |
Light containers create
more boxes than the network needs. |
Set practical cube targets
and audit actual loading results. |
|
Blurred ownership |
Every miss gets blended
into one service number. |
Score provider, source,
booking, and customer handoff separately. |
Part Two: Where Real Savings and Control Come From
Real freight savings do not come from chasing the cheapest move. They come from seeing trouble early and making better choices before cost hardens.
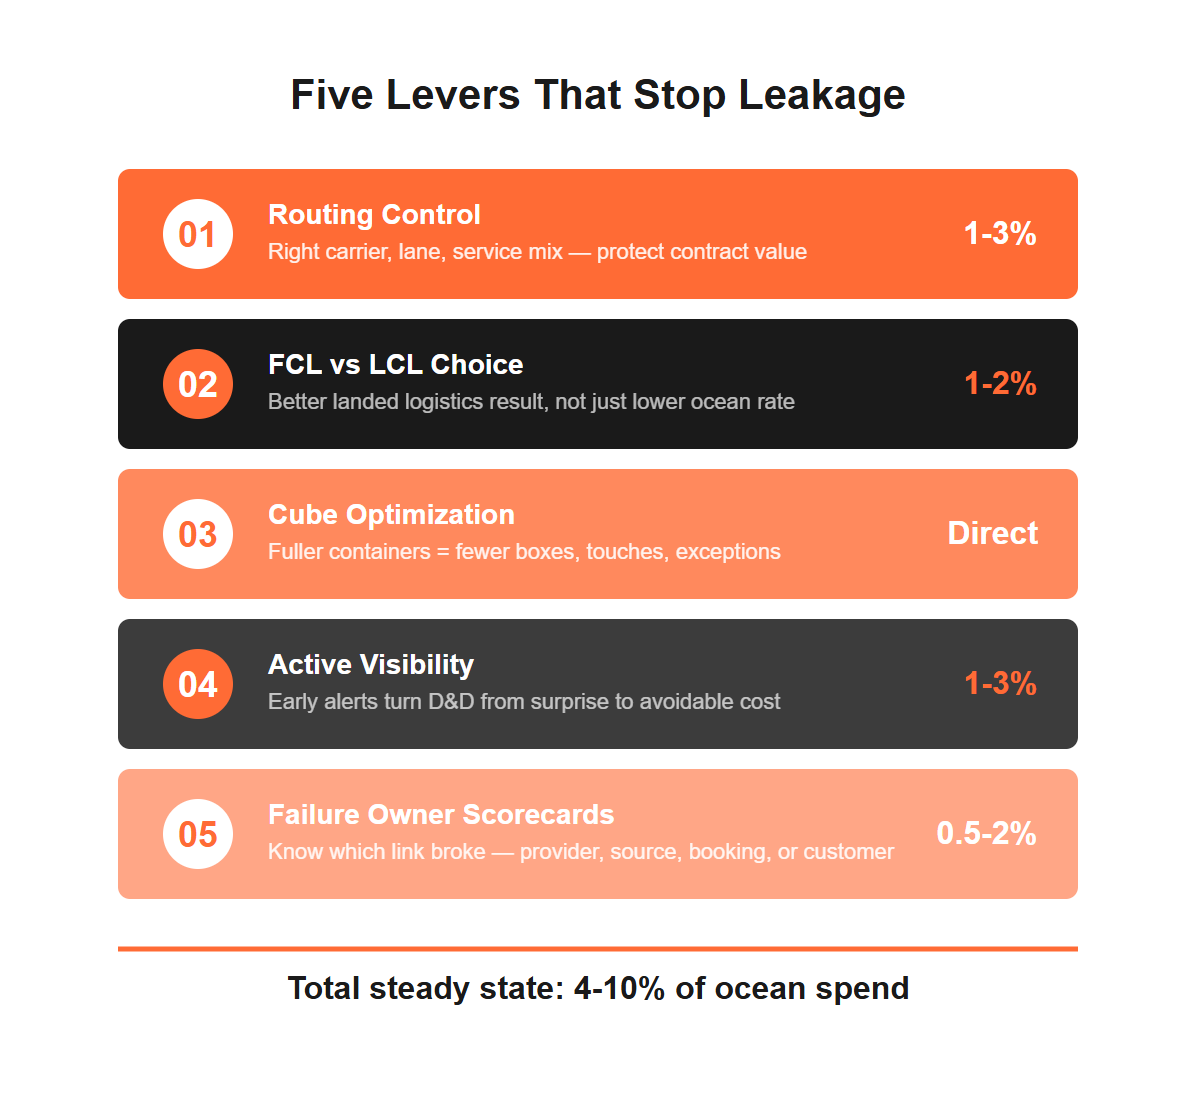
Start with routing control. Good routing is not just picking a carrier. It is protecting the full contract plan. When volume moves to the right carrier, lane, service, and season, the company gets the ocean value it negotiated. When volume drifts, MQCs suffer, spot use grows, and the buying story gets weaker next year.
You want to have access to spot rates but mix it in with you contracted commitments? Brilliant idea. Your MQC can be set at a lower level than your expected volumes like 80/20. This gives you room to take advantage of mid-contract opportunities but not screw up the benefits you have from a solid contract with good carriers or forwarders. But this kind of plan does require active management – you cannot just set it up and forget you have it!
Next comes FCL versus LCL. The smart question is not, "Which rate is lower?" The smart question is, "Which choice gives the better landed logistics ex-duty result?" That includes ocean freight, inland moves, handling, delay risk, damage risk, expedite risk, and admin noise. Sometimes LCL wins. Sometimes a 20-foot FCL wins because fewer touches and stronger ETA confidence protect the total cost.
Then there is cube. Better loading is not just a warehouse win. It is a network savings lever. Fuller containers mean fewer boxes, fewer drays, fewer documents, fewer touches, and fewer chances for something to go sideways. Ocean savings start inside the container. For every 5% of utilization you miss out on, you will need 5% more cube meaning you will need to use more containers. You ship 1000 containers for example, but could improve your utilization overall by 5%, you will cut your container needs by more than 5%
The next lever is active visibility. A useful TMS should not only show where freight is. It should warn when freight is stuck, free time is at risk, a container has not been unloaded, or equipment has not been returned. Those alerts are trip wires. They turn silence into action. D&D should not be a surprise invoice. It should be an exception that the team can attack while the cost is still avoidable.
Last is performance by a failure owner. They could be your providers, shippers, sources, booking teams, and even end customers. All are part of your touch chain. Each can save money or cost you more. Each can break the flow. If the scorecard blends every failure into one big OTIF number, nobody learns enough to fix the real cause.
This is the shift: ocean transport savings come from better rates, routing, equipment, and carrier use. Landed logistics ex-duty savings come from the full chain working better. The best operators manage both.
Part Three: Turning Leakage Control Into Margin
Bad freight costs you more for the same reason good freight saves you more: control or lack of it.
That is the bridge across this series. Part One showed where money leaks away. Containers sit too long. Contracts are not well made or do not get well used. Shipments move in the wrong mode. Cubes run light. Failures repeat because ownership is fuzzy.
Part Two showed the answer. Strong routing, early alerts, full practical cubing, and clear scorecards stop leaks before they become real cost. Trip wires built in the process as alarms to control towers that a shipment is in trouble. The common thread is not luck. It is control.
This matters because many companies still manage freight in pieces. Procurement studies rates. Operations books freight. Planning watches inventory. Customer teams chase service. Finance sees the cost after the fact. But the network does not behave in pieces. One weak decision pushes cost into the next team and no oversight to see the big picture
One of our shipper case studies is a manufacturing company with a global business. They were spending $30M USD in ocean freight annually. Their total landed logistics costs ex duty amounted to $44M USD with the majority of the volumes from Asia to North America.
Here is how this shipper improved their spends and reduced costs:
· Contract, MQC, and routing & execution discipline cut 2.5% from their ocean freight spend for $750,000 savings.
· FCL/LCL and routing design decisions with LCL being a much smaller portion of their activity still reduced costs by $120,000. The optimizing of FCL/LCL decision making though was a great overall service improvement.
· D&D/per diem charges that first year was greatly impacted with a reduction of a $880,000 USD about 2.0% of Landed Logistics Costs ex duty.
· Inventory and working-capital gains can reduce logistics-related inventory carrying cost by 0.6% for a savings of $260,000 of the Landed Logistics Costs.
· Reducing Performance failures like container utilization and maximizing /right sizing container types, cut a whopping 2.5% from Landed Logistics Costs. This focus cut the number of containers needed by 3% overall with a savings amount of $1.1M USD savings.
This case came up with a 7% reduction, $3M USD, overall in their landed logistics costs. Again, does not include duties paid.
Planning matters and execution. Optimizations help greatly as do finding and curing failures quickly. Either you can fix a failure enroute or you prevent that failure from happening again. This is way the data and information sources really help and why the data tools and experience of your team really counts!
The savings ranges below are directional, not promises. They should not be added straight across because several levers overlap. For a complex importer, a sensible steady-state opportunity may be roughly 4% to 10% of ocean freight spend, or even 2% to 7% of your full landed logistics ex-duty costs.
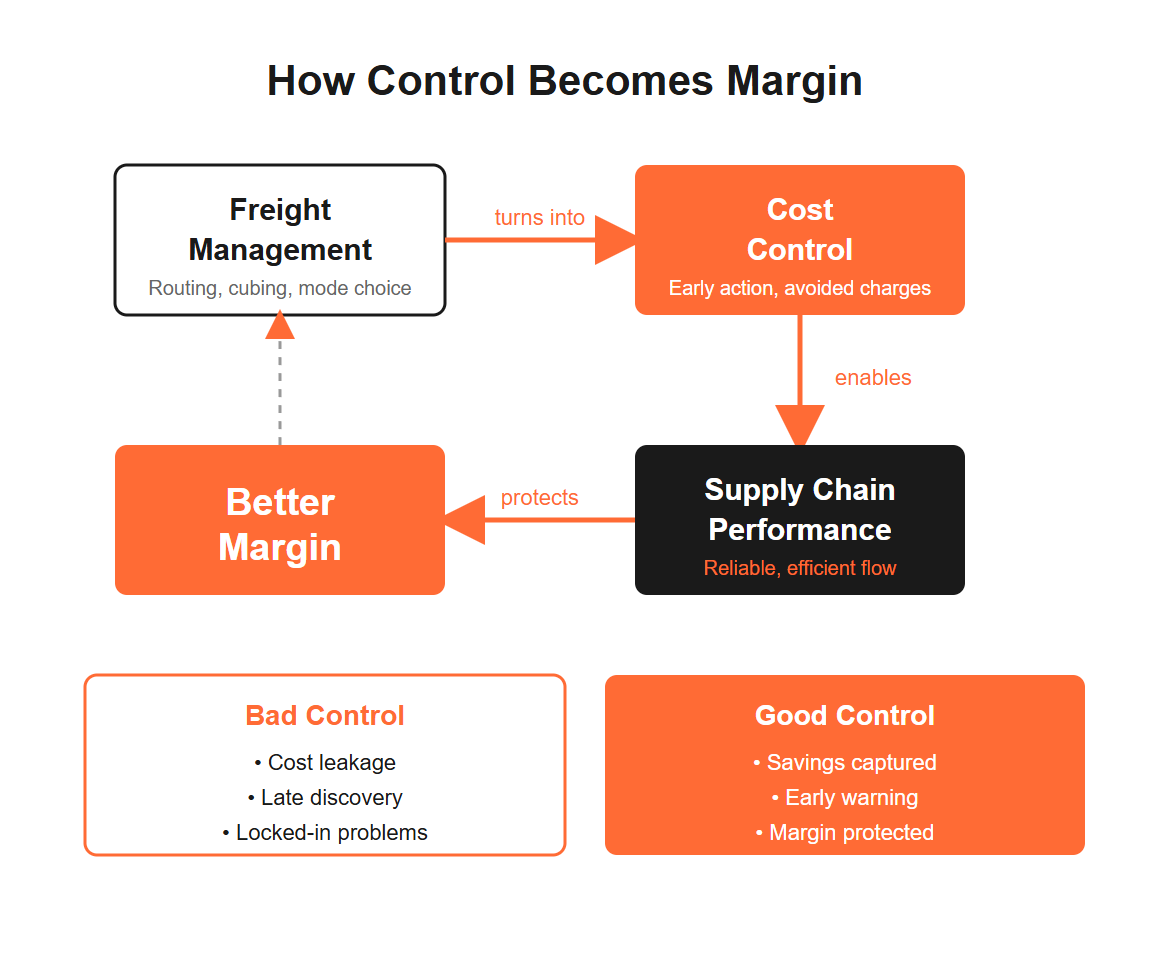
That is the point. Bad control creates leakage. Good control creates savings. Late discovery creates cost. Early warning protects margin.
This is how freight management turns into cost control. And this is how cost control turns into better supply chain performance.
note:
a. Landed logistics ex-duty means all the logistics costs and charges except customs duty amounts. This includes the ocean freight of course but also all the different destination and origin fees and charges including drayage and intermodal services, per diem charges (D&D), OTHC & DTHC, customs filing & ISF fees, etc. In Landed Logistics, ocean freight typically is the largest spend at a range of 50-75% of the total.
b. Actual results depend on trade lane mix, service profile, cargo type, carrier behavior, and how consistently the control process is managed.
