



Opening snapshot
WOW! Rates are crazy on the big money trade lanes. Transpacific especially but Asia-Europe/Med still are very high priced.
July opens as a tight, carrier-controlled market with real rate impact. Our newest July rate lane table shows broad increases versus prior benchmarks, especially Asia and Southeast Asia into North America. Not at past "covid" level for sure but in any other modern period, at a real high level. The capacity is improving in spots, but it is not yet enough to erase surcharge, space, and reliability risk.
Bottom line: protect customer-critical freight, keep it moving, but try not to panic-buy space. Book early, confirm sailing integrity, isolate surcharges, and be ready to push back on your carriers/NVOCCs to honor their contracts with you. They will be back in front of you when demand fades and capacity returns later this season!
1. July summary
|
Signal |
July 3 read |
WOWL move |
|
Demand |
Early peak demand and
tariff front-loading are still pulling volume forward. |
Rank customer-critical
orders first; do not treat all volume as equal. |
|
Capacity |
Capacity is improving on paper, but detours, port congestion,
vessel bunching, and blanks still limit usable space. |
Book priority freight 3-4 weeks ahead; review premium need
weekly. |
|
Rates |
The July 3 rate table shows
broad increases versus prior benchmarks, led by Asia / Southeast Asia to
North America. |
Keep quote validity short;
separate base rate, PSS/GRI, BAF/EBS, and inland fuel. |
|
Reliability |
Rollovers, heavy-cargo rules, cut-off misses, and transshipment
delays remain the operating risk. |
Confirm ETD, equipment, VGM, CY cut-off, and inland capacity
before cargo release. |
|
Main swing factors |
Tariff timing, Middle East
risk, Suez/Cape routing, fuel, and port congestion still drive the next move. |
Plan with ranges, not one
fixed rate assumption. |
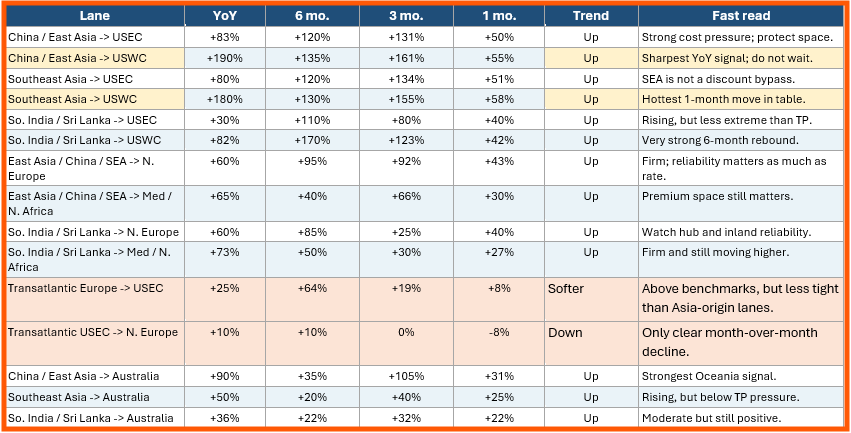
2. Rate movement table - as of 3 July
How to read it: percentages compare the current spot-rate level to the prior benchmark. +50% means today is 50% higher than that benchmark. A negative number means today is below that benchmark. Near-term trend is a WOWL general directional read, not a formula. No dollar values are shown.
3. Trend analysis from the rate table
|
Trend |
What it means
for shippers |
|
Transpacific leads |
China/East Asia and
Southeast Asia to North America show the strongest YoY, 3-month, and 1-month
increases. USWC is the hottest pressure point. |
|
Southeast Asia is tight too |
SEA lanes are moving in the same direction as China. Sourcing
diversification does not remove space risk. |
|
Europe / Med is firm |
Asia to North Europe and
Med/North Africa is above prior benchmarks, but the pace is less intense
compared to Transpacific. |
|
ISC / Sri Lanka is uneven |
USWC and Europe/MED lanes show real upward pressure. Use early
booking and avoid single-hub dependency. |
|
Transatlantic is different |
TA lanes are still above older
benchmarks, but near-term pricing is softer. Price those lanes separately; do
not apply Asia-origin logic. |
|
Australia is mixed-upward |
Oceania is rising, led by China/East Asia to Australia, but it is
not the same pressure curve as North America. |
4. Trade-lane heat map - next 6 to 8 weeks
|
Lane |
Demand |
Space /
reliability |
Rate |
Action |
|
Asia -> NA West Coast |
Strong |
Tight; selective extra
loaders help. |
Up sharply |
Book 3-4 weeks early;
protect 40HC/heavy cargo. |
|
Asia -> NA East & Gulf |
Strong |
Most constrained; routing and equipment risk. |
Up sharply |
Protect core volume; validate VGM/weight early. |
|
Asia -> North Europe |
Firm |
Cape routing continues + destination port delay + yard/inland pressure. |
Up |
Confirm space before
release; add buffers. |
|
Asia -> Med / MENA |
Firm / volatile |
Premium-space risk from Suez/Gulf disruption. Cape routing here
also. |
Up |
Use premium only where service need justifies it. |
|
ISC / Sri Lanka -> NA
& Europe |
Steady to rising |
Hub reliability uneven;
gateway shifts active. |
Up |
Lock space early; avoid
single-hub dependency. |
|
Intra-Asia / Transatlantic |
Active / stable |
Feeder pressure in Asia; Transatlantic more workable. |
Mixed |
Price lane-by-lane; watch feeders and dwell. |
|
Asia -> LATAM / Oceania |
Strong / mixed |
LATAM tight; Oceania rising
but uneven. |
Up / mixed |
Check service changes
before committing lead times. |
5. Structural watch
|
Watch item |
What it is
doing now |
WOWL guidance |
|
Tariff clock |
Late-July tariff
uncertainty remains a demand-pull-forward trigger. |
Do not let freight planning
outrun customs planning. |
|
Suez / Cape |
Cape routings still absorb effective capacity and extend transit
time. |
Keep longer lead times. Do not budget on a sudden Suez return. |
|
Hormuz / Gulf |
Transits are improving from
crisis lows, but risk is not normalized. |
Review Gulf routing,
insurance, surcharges, and diversion plans weekly. |
|
BAF / EBS / PSS |
Fuel and peak-season surcharges are central to landed cost. |
Separate every surcharge from base rates in budgets and customer
quotes. |
|
Network shift |
Carriers are leaning harder
on secondary gateways and relay ports as mega-hubs stay stressed. |
Audit full routing: feeder,
transshipment, inland handoff, and alternate gateways. |
6. Port & gateway watchlist
|
Region |
Hotspots |
What to watch |
|
Far East & SE Asia |
Shanghai, Ningbo, Qingdao,
Yantian, Singapore, Port Klang, Tanjung Pelepas, Haiphong, Laem Chabang,
Manila |
Weather, vessel bunching,
feeder delay, 40HC pockets, cutoff changes. |
|
ISC & Middle East |
Mundra, Nhava Sheva, Colombo, Jeddah, Sohar, Khor Fakkan,
Salalah, Gulf ports |
Hub buffers, relay cargo, Gulf security, equipment, and overland
rerouting. |
|
North Europe & Med |
Rotterdam, Hamburg,
Antwerp-Bruges, Bremerhaven, Felixstowe, Genoa, Valencia |
Yard density, barge/rail
delay, mega-vessel bunching, slow inland release. |
|
North America |
LA/LB, NY/NJ, Savannah, Houston, Norfolk, Vancouver, selected
rail ramps |
Arrival bunching, rail dwell, dray appointments, chassis,
weekend/holiday recovery. |
7. July shipper playbook
Shippers/BCOs shipping mostly under contracts are in a superior position pricewise but are fighting carriers to protect space and use those low contract pricing.
|
Priority |
Action |
|
Protect critical freight |
Book 3-4 weeks ahead. Use
named-space or premium only where the order matters. |
|
Control landed cost |
Refresh rate cards, BAF/EBS/PSS, dray, rail, and customer quote
validity weekly. |
|
Segment cargo |
Separate promise-date
freight from flexible freight. Do not premium-buy the whole book. |
|
Consolidate smarter |
Avoid rushed LCL, partial pallets, half-full containers, and
last-minute 20-ft substitutions. |
|
Use lane logic |
Push hardest where
Transatlantic or flexible lanes soften; protect where Asia/SEA/ISC pressure
remains high. |
|
Escalate early |
Flag risk before cutoff problems become service failures.
Shipping happens; recovery works better early. |
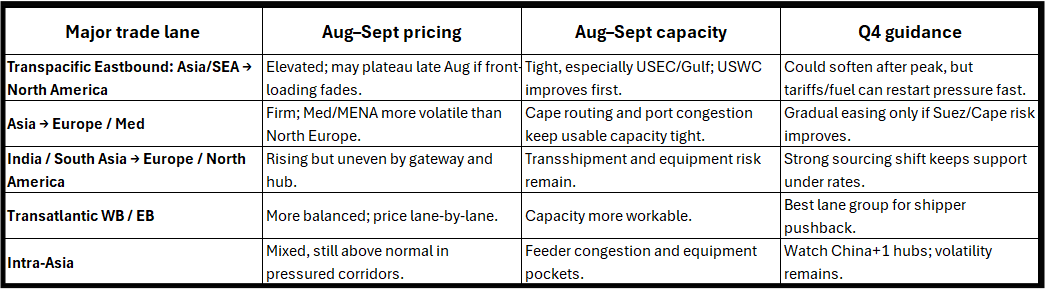
8. Forecast forward
Conclusion
July is still carrier-favorable on the hot lanes, but the table makes the real point clear: not every market is moving the same way. Transpacific and several ISC lanes need early protection. Transatlantic should have a separate pricing strategy. The winning move is disciplined urgency: protect the right cargo, consolidate better, and price reliability as part of landed cost. Market shift back to a balanced sanity still to come as Peak should burn out hopefully by September or sooner.
WOWL helps clients manage global ocean freight with market guidance, carrier strategy, routing options, and hands-on execution. We connect market noise to shipment decisions.
#OceanFreight #GlobalLogistics #SupplyChain #Transpacific #AsiaEurope #FreightMarket #TradeCompliance #WOWL #ITMS
Source scan through 3-Jul-2026: July 3 rate percent-change workbook, Drewry WCI 02-Jul, Drewry Cancelled Sailings Tracker 03-Jul, DHL June 2026 OFR update, Bunker Index 03-Jul, JOC public headlines, FT/WSJ public market reporting, and prior WOWL June format.
Andy Gillespie | AndyG@WOWL.io | Visit WOWL.io for more information

