
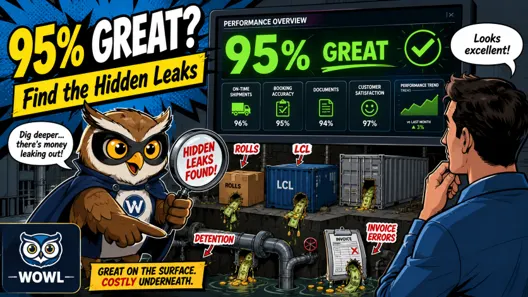

That sounds wrong. It is not.
Most companies manage logistics through averages and overall scores like:
- On-time performance
- Average transit
- Freight cost
- Carrier reliability
- Supplier compliance
- Container utilization
When a score falls below target; the team attacks it.
That makes sense.
But what about the areas scoring 90%, 95%, or even 98%?
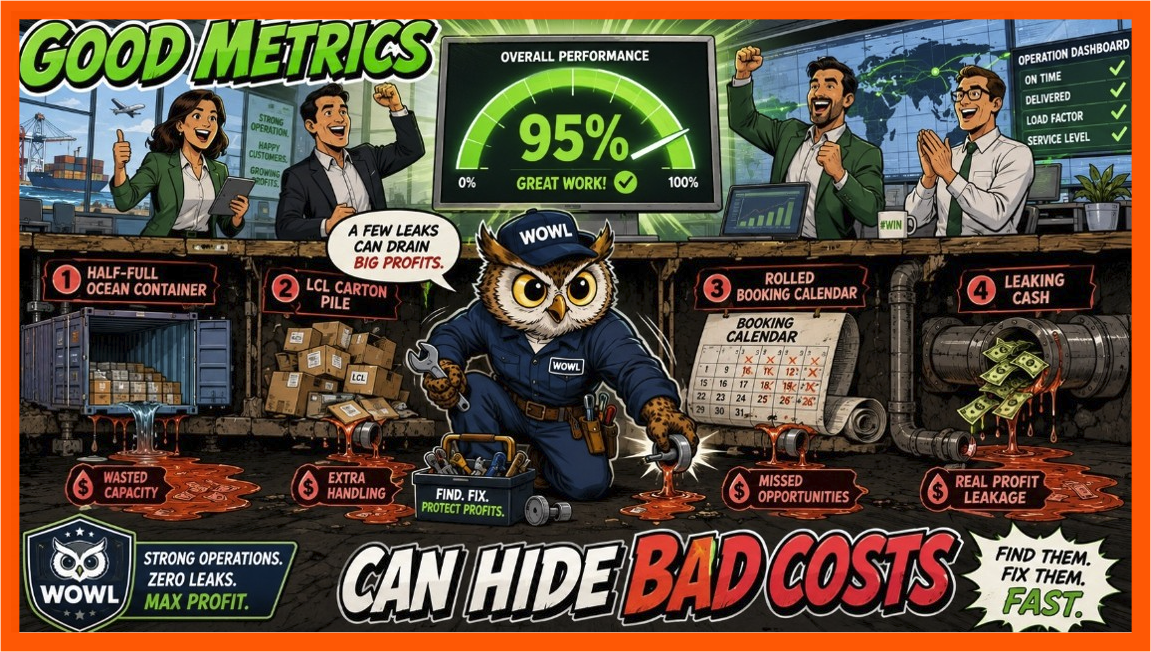
They often get a green light. No questions asked. But major cost leaks are still there, hiding in plain sight!
A carrier may perform well overall but regularly roll containers on one important port pair.
A supplier may ship 96% on time, while the remaining 4% triggers airfreight, LCL, missed sailings, and inventory shortages.
A forwarder may deliver strong service globally, while one office produces poor data, late bookings, and repeated invoice errors.
The overall score looks good.
The exceptions are expensive.
This is the problem with averages. They can bury the worst failures inside many successful shipments.
A company may have only ten serious detention cases during the month. That may look minor against 1,000 containers.
But what if those ten cases create half the month’s avoidable accessorial cost?
A few half-empty containers may not damage the utilization average. Several unnecessary LCL shipments may not attract attention. A handful of late booking cancellations may not move the KPI.
Yet each can leak thousands of dollars.
The right question is not only: Which areas are performing below target?
It is also: Which of these failures are costing us the most money or which are easily corrected—especially inside areas performing well?
Look deeper:
- Carrier by port pair
- By each supplier/factory
- Forwarder by office
- Cost by exception
- Worst 5% of shipments
- Repeat failures by root cause
- Container utilization
Questions to Ask Your Team
- Which 5% of shipments created the most extra cost?
- Which strong-performing provider owns our most expensive failures?
- Which lanes look good overall but have costly outliers?
- Which exceptions keep repeating?
- Are we measuring percentages—or actual financial impact?
- Who owns the corrective action?
- Are the savings being verified?
Measure the dollars behind the failure. Not just the percentage. Then identify the cause. Fix the process. Verify the savings.
WOWL helps shippers understand the data behind their operations—across carriers, forwarders, suppliers, bookings, shipments, and costs. AI and BI wrapped together with freight experience of the WOWL team with you!
Because secret profit leaks do not stay secret once the right data is connected, measured, and acted upon.
The biggest leak may be hiding inside one of your best-performing areas.
AndyG@WOWL.io
#TransporationCost #OceanFreight #GlobalOcean #FreightAnalysis #OriginMgmt #ITMS
Go to WOWL.io for a personal demo!

